
Photo Credit: Syda Productions / Shutterstock
Prior to 2015, same-sex marriage was legal in just 37 states and the District of Columbia. But in 2015, the U.S. Supreme Court ruled in a landmark decision—Obergefell v. Hodges—that all states must license and recognize marriages between same-sex couples, leading to a large increase in the number of same-sex marriages. Currently, same-sex married couples acount for about 1% of all married couples in the U.S., according to 2020 Census Bureau data.
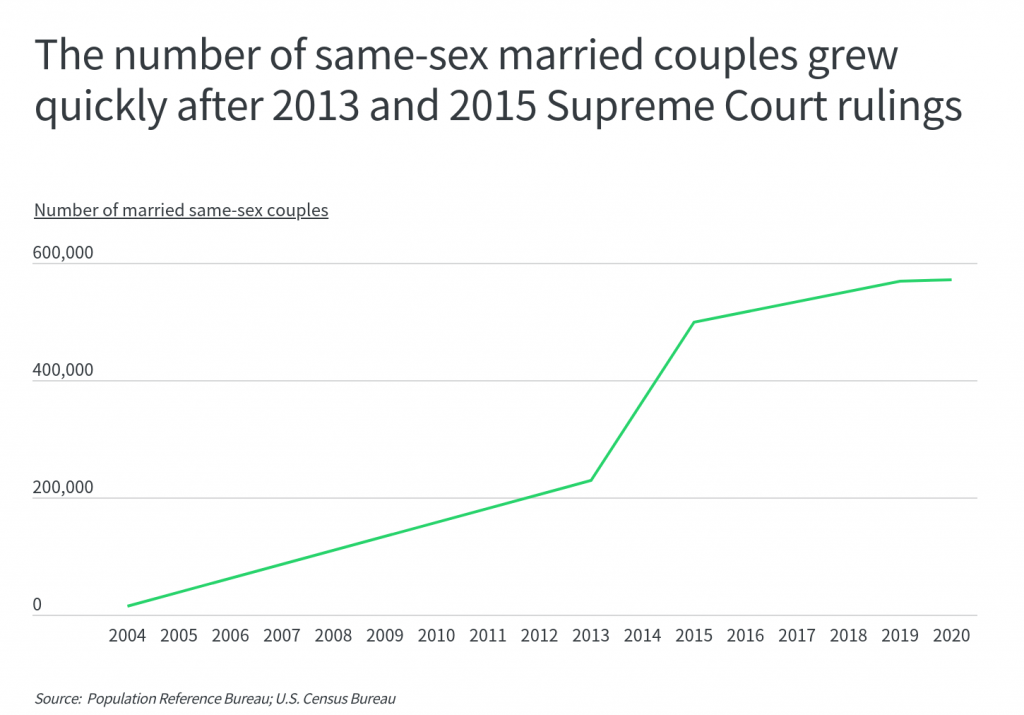
Prior to Obergefell v. Hodges, a separate 2013 Supreme Court ruling required the federal government to recognize state-sanctioned same-sex marriages, extending federal benefits to same-sex couples married in those states. Research by demographers at the University of California Los Angeles School of Law shows that there were an estimated 230,000 same-sex married couples in 2013, accounting for 21% of all same-sex couples. By June 2015, when same-sex marriage was legalized across the country, the number of same-sex marriages was 390,000, or 38% of all same-sex couples. Just a few months later, in October 2015, the number of same-sex marriages had increased to 486,000, or 45% of all same-sex couples.
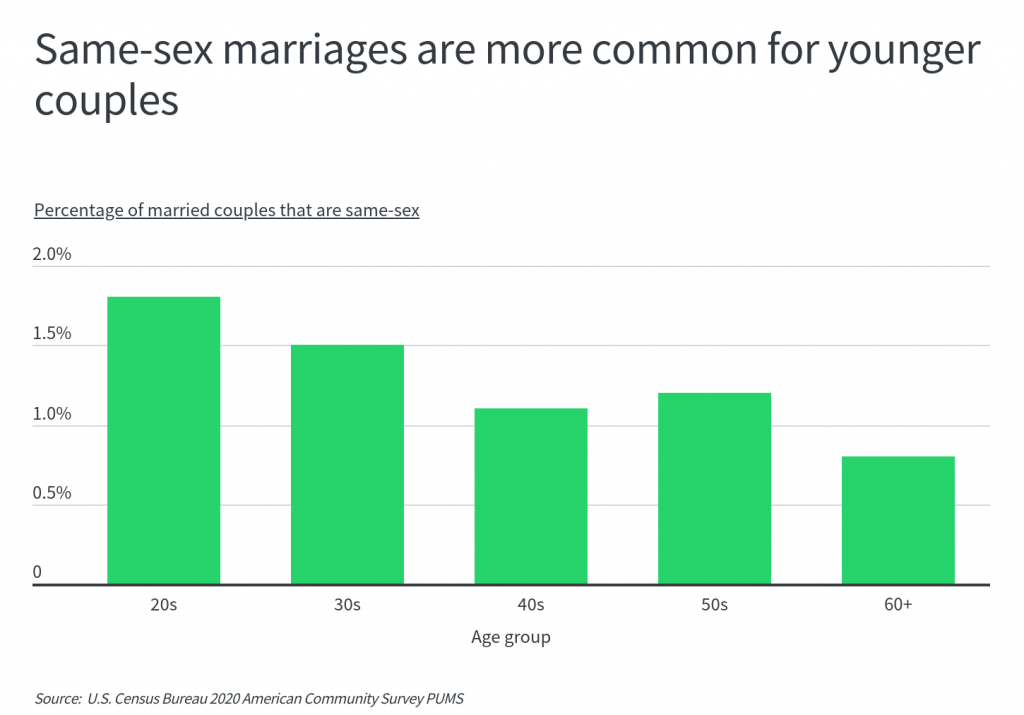
While same-sex marriages are becoming more common, same-sex married couples differ demographically from opposite-sex couples. According to the Tax Policy Center, same-sex married couples skew younger, have higher incomes, and are less likely to have dependents. Indeed, Census Data shows that among married couples in their 20s and 30s, same-sex couples account for 1.8% and 1.5% of married couples, respectively. For married couples 60 and older, same-sex marriages account for about half that at 0.8%.
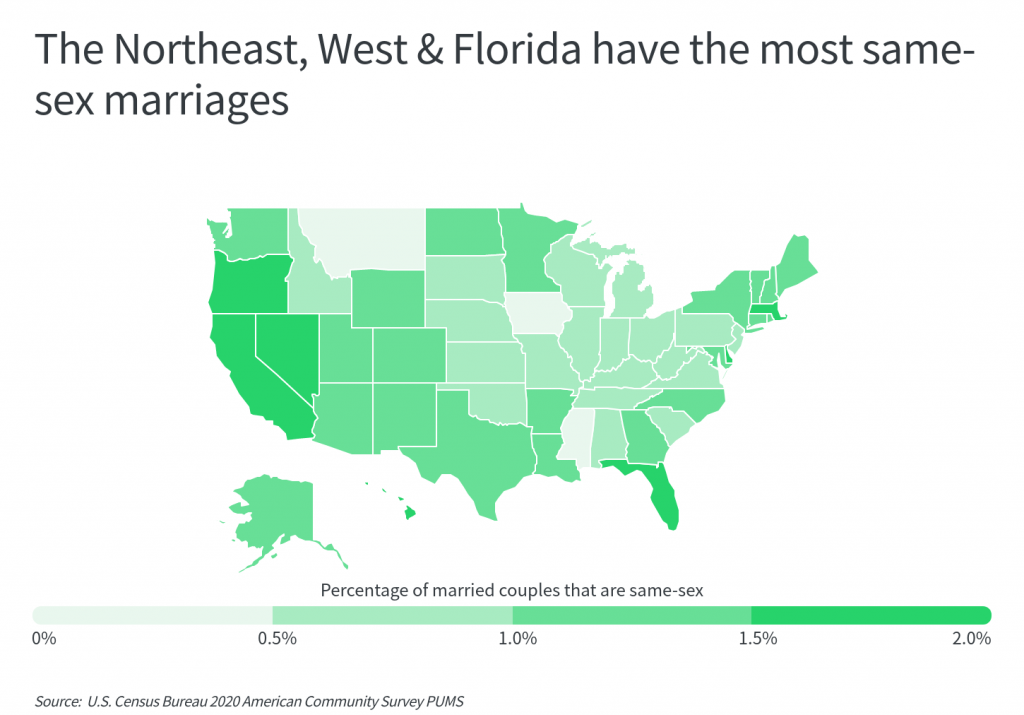
Same-sex married couples are highly geographically concentrated, both on a regional basis and also at the local level. States, cities, and neighborhoods report large gaps in their same-sex couple populations. At the regional level, the Northeast and West Coast have large shares of same-sex married couples. When considering states, Nevada, Delaware, Florida, and Massachusetts have the largest proportions of same-sex couples, with 1.7–1.8% of married couples being same-sex. In general, states in which same-sex marriage was legal prior to 2015 report more same-sex marriages. On the opposite end of the spectrum, Mississippi and Montana have the lowest shares of same-sex married couples, with just 0.3% of married couples being of the same sex.
To find the metropolitan areas with the most same-sex marriages, researchers at NameChk.com analyzed the latest data from the U.S. Census Bureau. The researchers ranked metros according to the percentage of married couple households that are same-sex. Researchers also calculated the percentage of same-sex couple households that are married, the total number of same-sex married couple households, the total number of male married couple households, and the total number of female married couple households. Only the 100 most populous metro areas were included in the analysis.
Major U.S. Metros With the Most Same-Sex Marriages
Photo Credit: Chones / Shutterstock
15. Los Angeles-Long Beach-Anaheim, CA
- Percentage of married couples that are same-sex: 1.6%
- Percentage of same-sex couples that are married: 57.9%
- Total same-sex married couples: 33,965
- Total male married couples: 18,780
- Total female married couples: 15,185
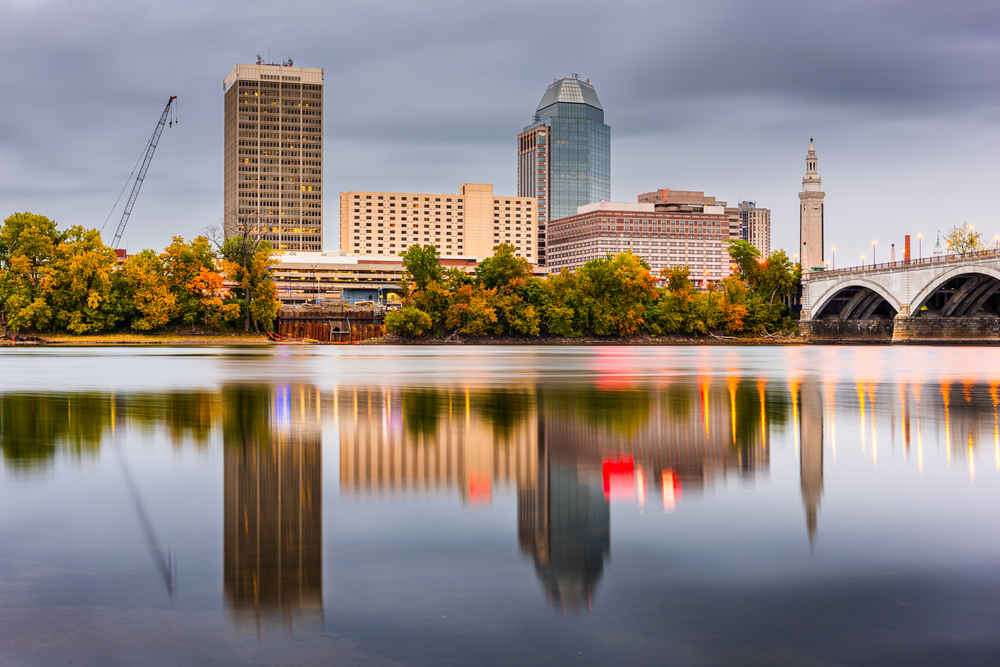
Photo Credit: Sean Pavone / Shutterstock
14. Springfield, MA
- Percentage of married couples that are same-sex: 1.7%
- Percentage of same-sex couples that are married: 82.2%
- Total same-sex married couples: 1,644
- Total male married couples: 321
- Total female married couples: 1,323
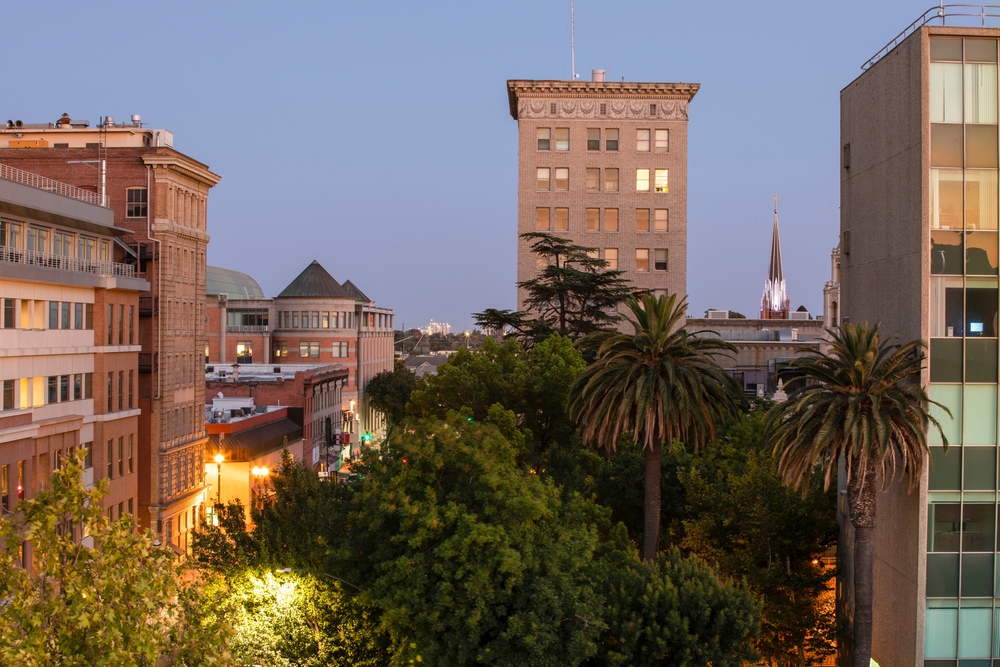
Photo Credit: Matt Gush / Shutterstock
13. Stockton-Lodi, CA
- Percentage of married couples that are same-sex: 1.7%
- Percentage of same-sex couples that are married: 83.4%
- Total same-sex married couples: 1,949
- Total male married couples: 787
- Total female married couples: 1,162
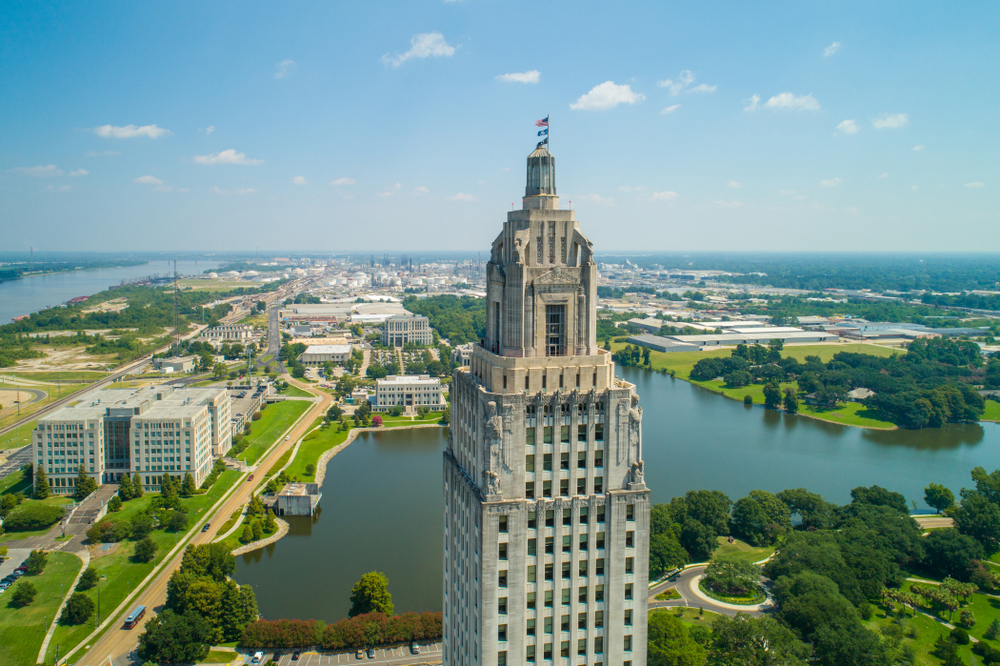
Photo Credit: Felix Mizioznikov / Shutterstock
12. Baton Rouge, LA
- Percentage of married couples that are same-sex: 1.7%
- Percentage of same-sex couples that are married: 83.6%
- Total same-sex married couples: 2,297
- Total male married couples: 1,008
- Total female married couples: 1,289
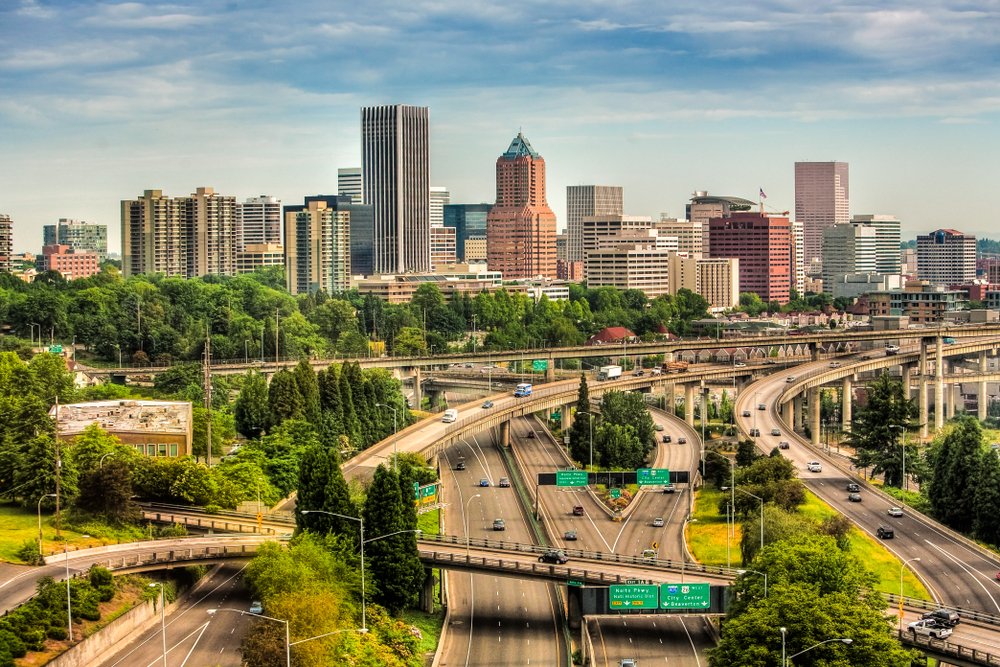
Photo Credit: Bob Pool / Shutterstock
11. Portland-Vancouver-Hillsboro, OR-WA
- Percentage of married couples that are same-sex: 1.7%
- Percentage of same-sex couples that are married: 59.2%
- Total same-sex married couples: 8,257
- Total male married couples: 3,110
- Total female married couples: 5,147
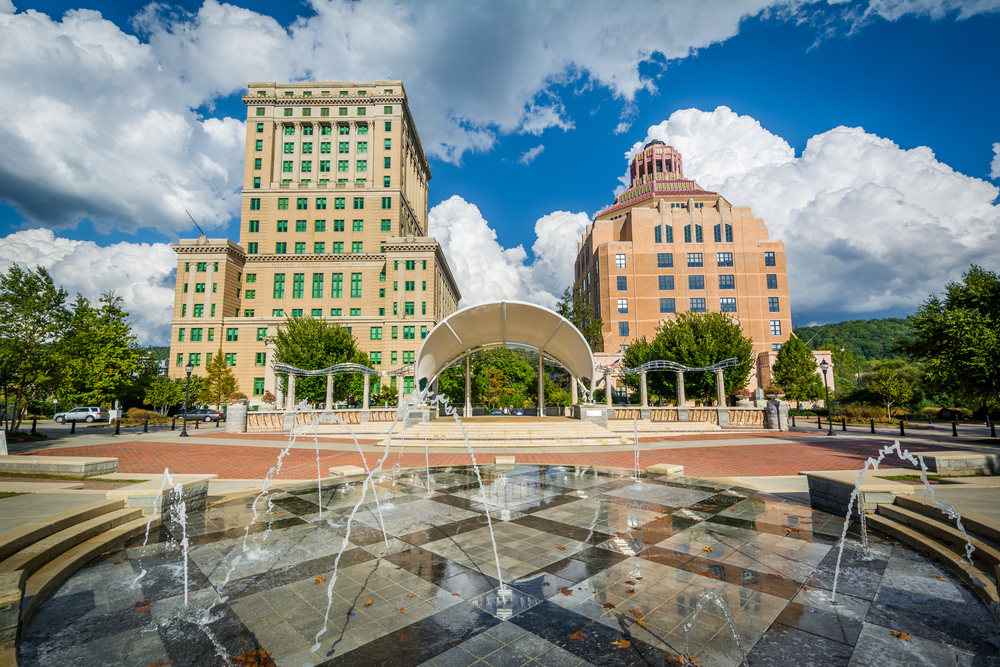
Photo Credit: Jon Bilous / Shutterstock
10. Asheville, NC
- Percentage of married couples that are same-sex: 1.8%
- Percentage of same-sex couples that are married: 57.4%
- Total same-sex married couples: 1,993
- Total male married couples: 1,314
- Total female married couples: 679
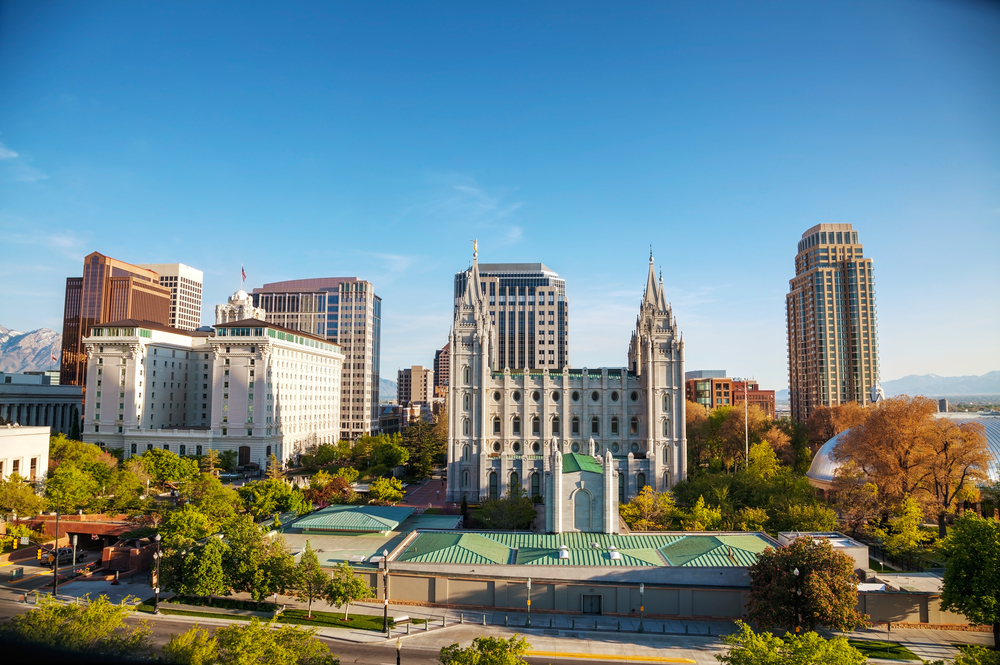
Photo Credit: photo.ua / Shutterstock
9. Salt Lake City, UT
- Percentage of married couples that are same-sex: 1.8%
- Percentage of same-sex couples that are married: 70.3%
- Total same-sex married couples: 4,161
- Total male married couples: 1,818
- Total female married couples: 2,343
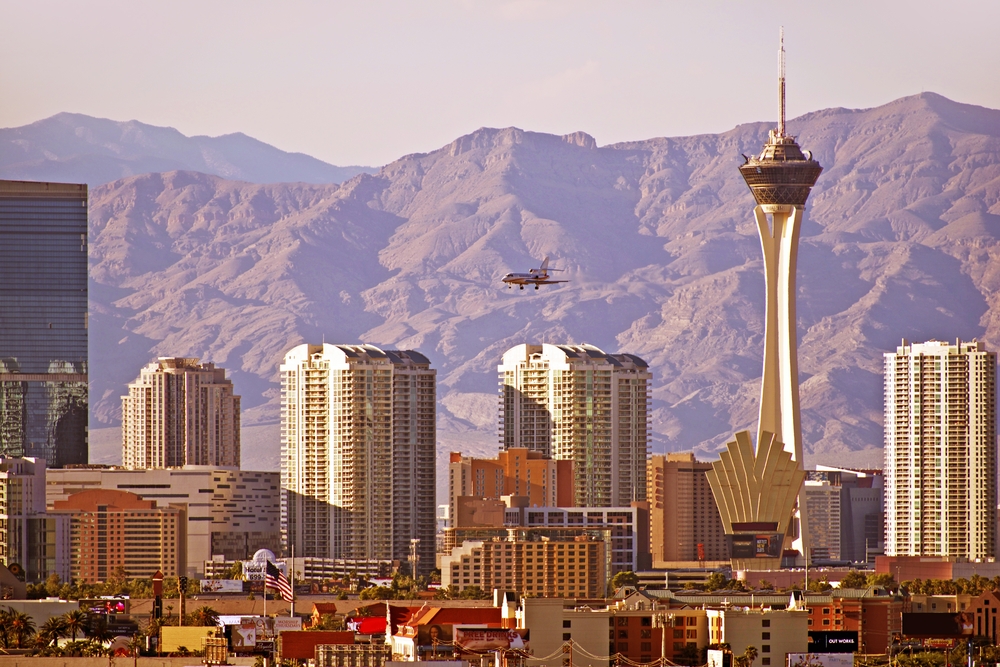
Photo Credit: Virrage Images / Shutterstock
8. Las Vegas-Henderson-Paradise, NV
- Percentage of married couples that are same-sex: 1.8%
- Percentage of same-sex couples that are married: 56.6%
- Total same-sex married couples: 6,914
- Total male married couples: 3,842
- Total female married couples: 3,072
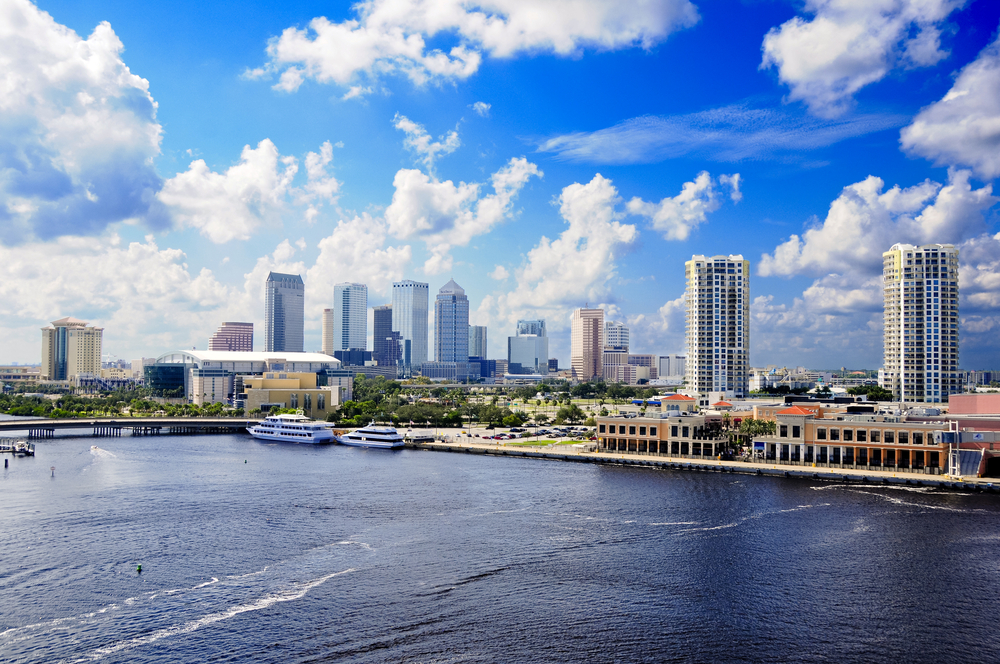
Photo Credit: Bonnie Fink / Shutterstock
7. Tampa-St. Petersburg-Clearwater, FL
- Percentage of married couples that are same-sex: 1.8%
- Percentage of same-sex couples that are married: 58.1%
- Total same-sex married couples: 11,141
- Total male married couples: 7,170
- Total female married couples: 3,971
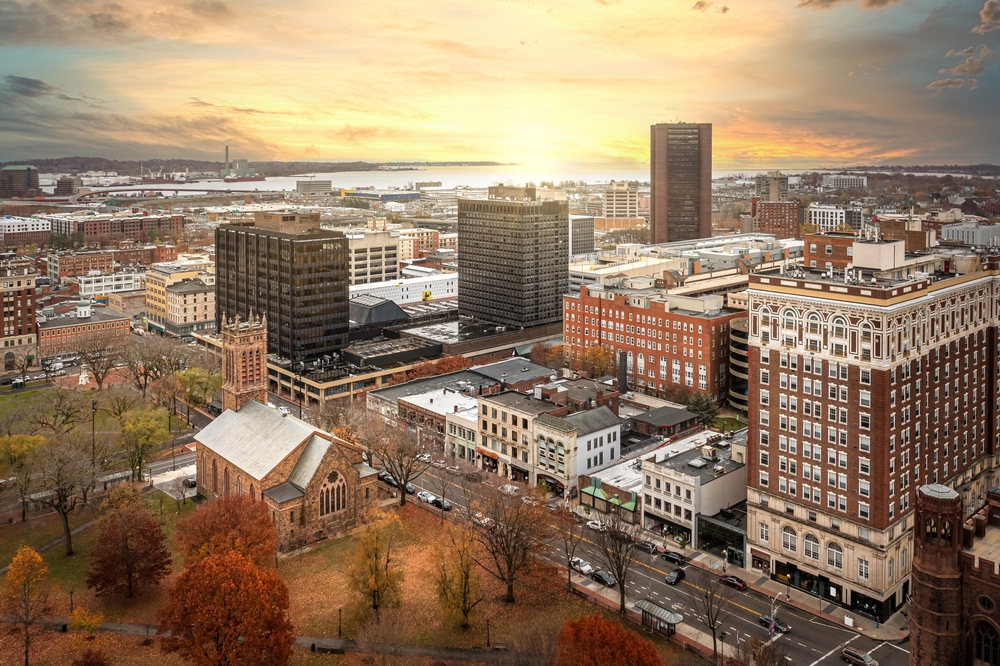
Photo Credit: RodClementPhotography / Shutterstock
6. New Haven-Milford, CT
- Percentage of married couples that are same-sex: 2.1%
- Percentage of same-sex couples that are married: 71.2%
- Total same-sex married couples: 3,127
- Total male married couples: 1,378
- Total female married couples: 1,749
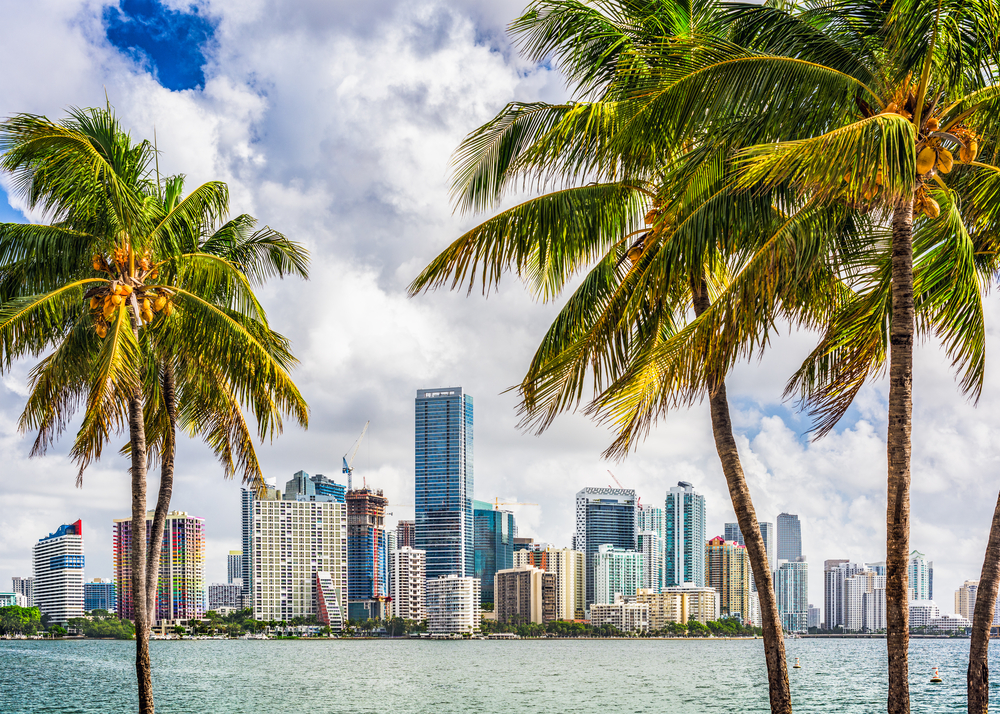
Photo Credit: Sean Pavone / Shutterstock
5. Miami-Fort Lauderdale-West Palm Beach, FL
- Percentage of married couples that are same-sex: 2.2%
- Percentage of same-sex couples that are married: 61.3%
- Total same-sex married couples: 22,590
- Total male married couples: 14,550
- Total female married couples: 8,040
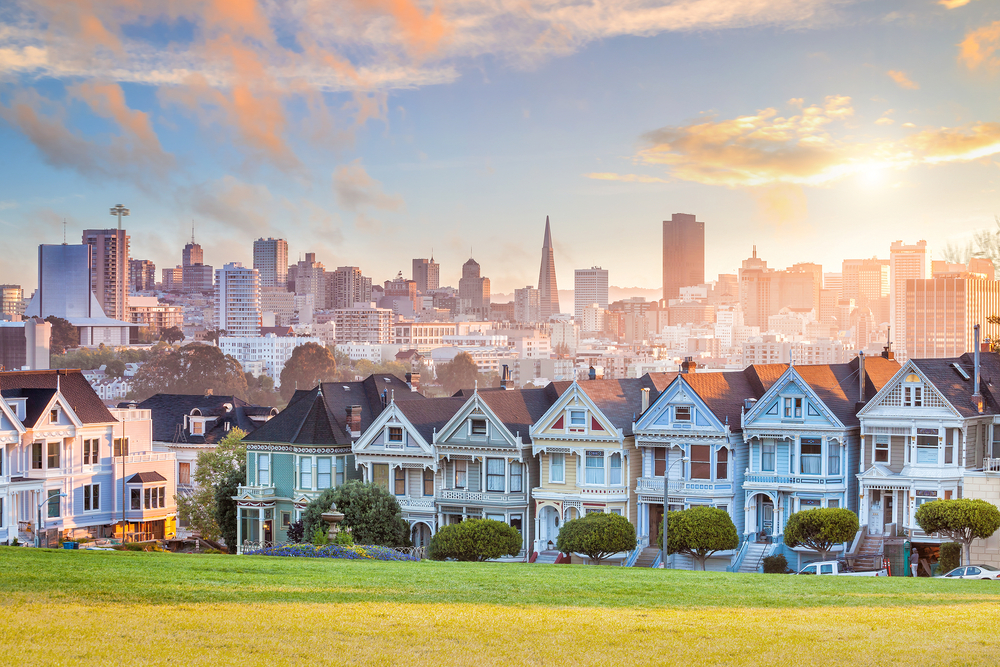
Photo Credit: f11photo / Shutterstock
4. San Francisco-Oakland-Hayward, CA
- Percentage of married couples that are same-sex: 2.3%
- Percentage of same-sex couples that are married: 58.3%
- Total same-sex married couples: 19,226
- Total male married couples: 11,582
- Total female married couples: 7,644

Photo Credit: Ercan Ekinci / Shutterstock
3. Palm Bay-Melbourne-Titusville, FL
- Percentage of married couples that are same-sex: 2.4%
- Percentage of same-sex couples that are married: 80.7%
- Total same-sex married couples: 2,931
- Total male married couples: 843
- Total female married couples: 2,088
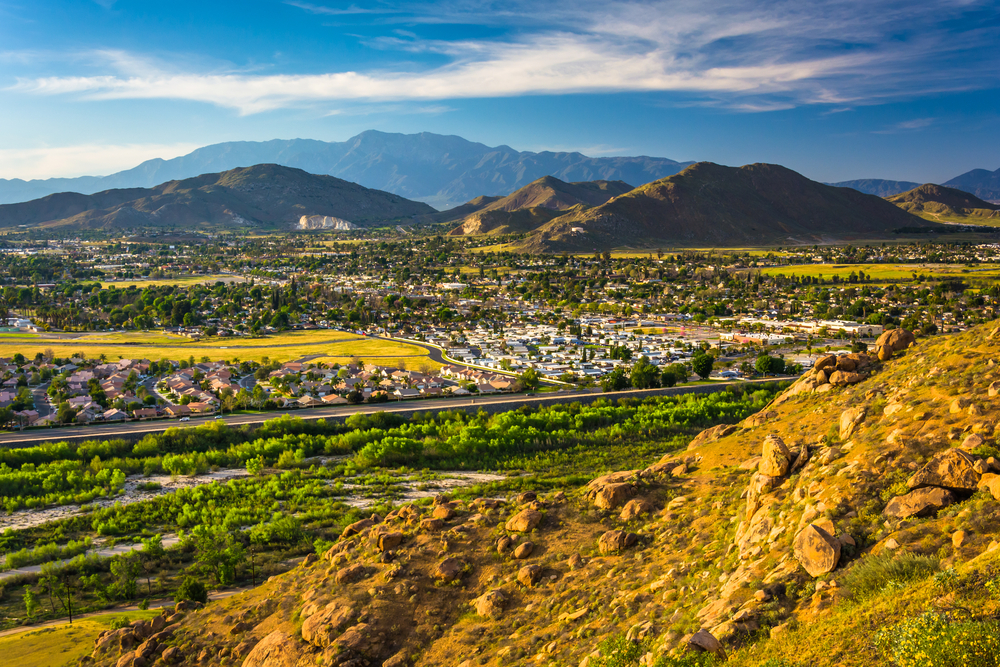
Photo Credit: Jon Bilous / Shutterstock
2. Riverside-San Bernardino-Ontario, CA
- Percentage of married couples that are same-sex: 2.4%
- Percentage of same-sex couples that are married: 65.4%
- Total same-sex married couples: 18,602
- Total male married couples: 10,591
- Total female married couples: 8,011
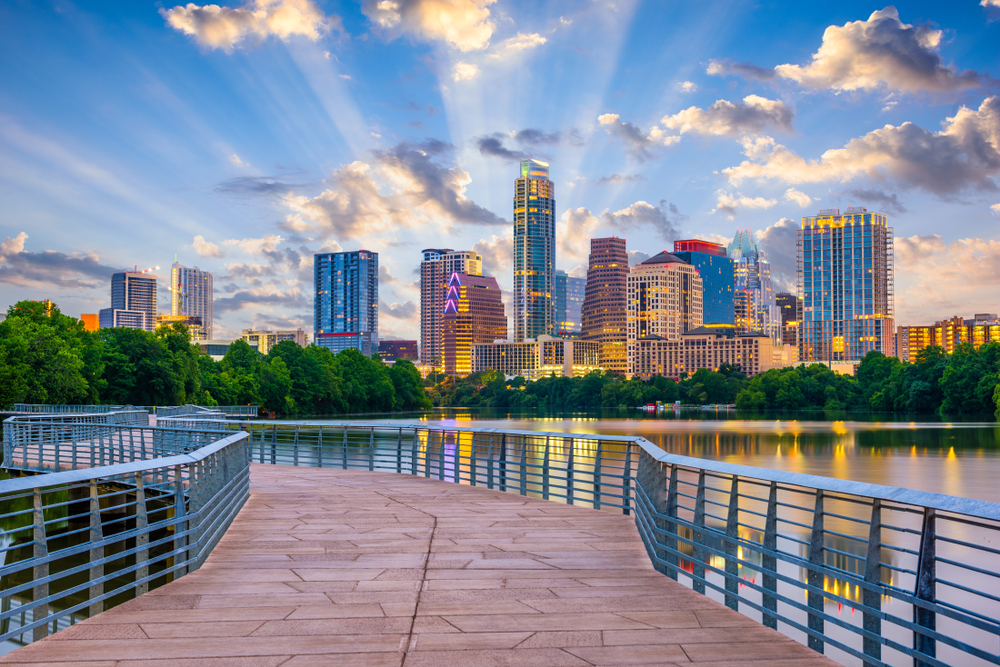
Photo Credit: Sean Pavone / Shutterstock
1. Austin-Round Rock, TX
- Percentage of married couples that are same-sex: 2.6%
- Percentage of same-sex couples that are married: 57.8%
- Total same-sex married couples: 11,696
- Total male married couples: 5,582
- Total female married couples: 6,114
Detailed Findings & Methodology
To find the metropolitan areas with the most same-sex marriages, researchers at NameChk analyzed data from the U.S. Census Bureau’s 2020 American Community Survey Public Use Microdata Sample. The researchers ranked metros according to the percentage of married couple households that are same-sex. In the event of a tie, the metro with the larger number of same-sex married couple households was ranked higher. Researchers also calculated the percentage of same-sex couple housheolds that are married, the total number of male married couple households, and the total number of female married couple households. Only the 100 most populous metro areas were included in the analysis.


