Photo Credit: Natee Meepian / Shutterstock
Where a person or business chooses to put down roots can have a significant impact on their costs, and in recent years, more people are moving to locations that will keep costs low.
Expensive states that have been major economic powers and population centers in the past, like California and New York, are seeing their population growth level out and more industries leave their state for inexpensive locations. Tech companies like Tesla, Oracle, and Hewlett Packard have recently announced plans to relocate operations outside of California, while banks and investment firms have moved more of their operations out of the New York metro in favor of locations in Florida. With the increased flexibility of remote work since the pandemic began, many households have also made the decision to move to lower-cost areas.
Key to many of these decisions is the effect of state and local tax rates. While federal income taxes are often first to come to peoples’ minds when thinking about taxation, states and localities vary widely in how they levy taxes on businesses and individuals. For example, nine states—including the aforementioned destination states of Texas and Florida—charge no individual state income tax, while five states have no sales taxes. Other states may distinguish themselves with low corporate or property tax rates.
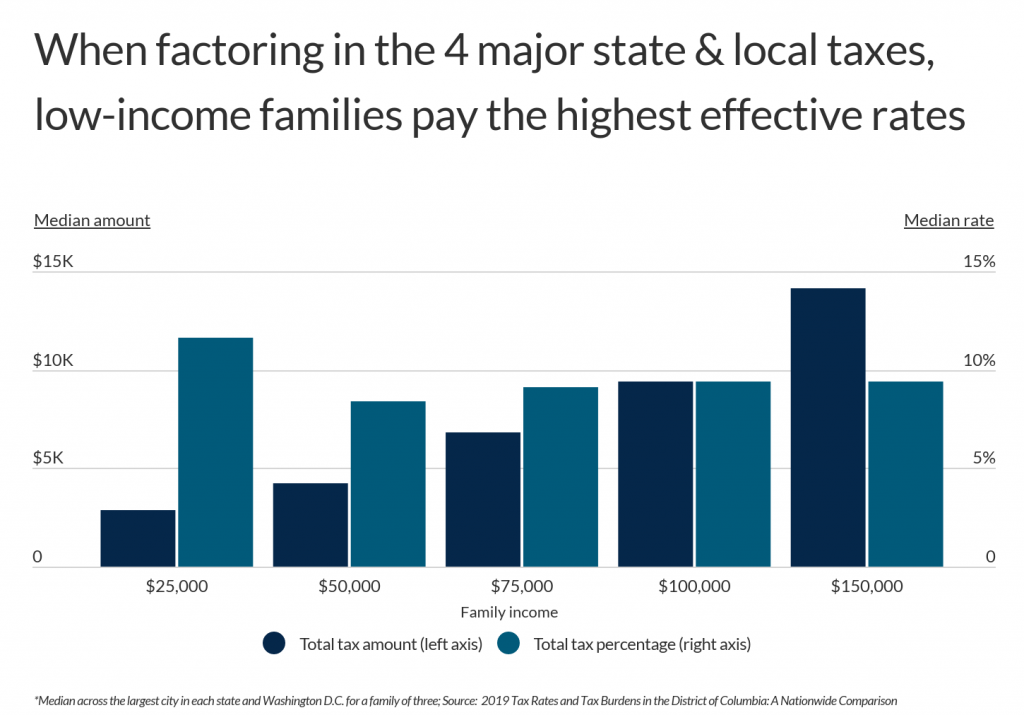
Despite this trend, not all taxpayers have the means to seek out locations with the lowest taxes. In fact, most low-income households are stuck paying higher effective tax rates when factoring in income, sales, automotive, and property taxes (including the property tax equivalent of rent). A typical family earning less than $25,000 will pay around $2,904 in state and local taxes each year, or 11.6%. Meanwhile, a family earning $150,000 pays nearly five times as much in total taxes—$14,173—but has a lower effective tax rate of 9.4%.

The reason is that different forms of taxation have different impacts. Taxes can be considered regressive or progressive depending on whether they disproportionately burden lower or higher income earners, respectively. For example, income taxes and property taxes are usually structured more progressively because they charge people with more income or assets more heavily. In contrast, sales taxes are considered regressive because while they charge all payers the same rate, they take up a larger share of income for lower earners.
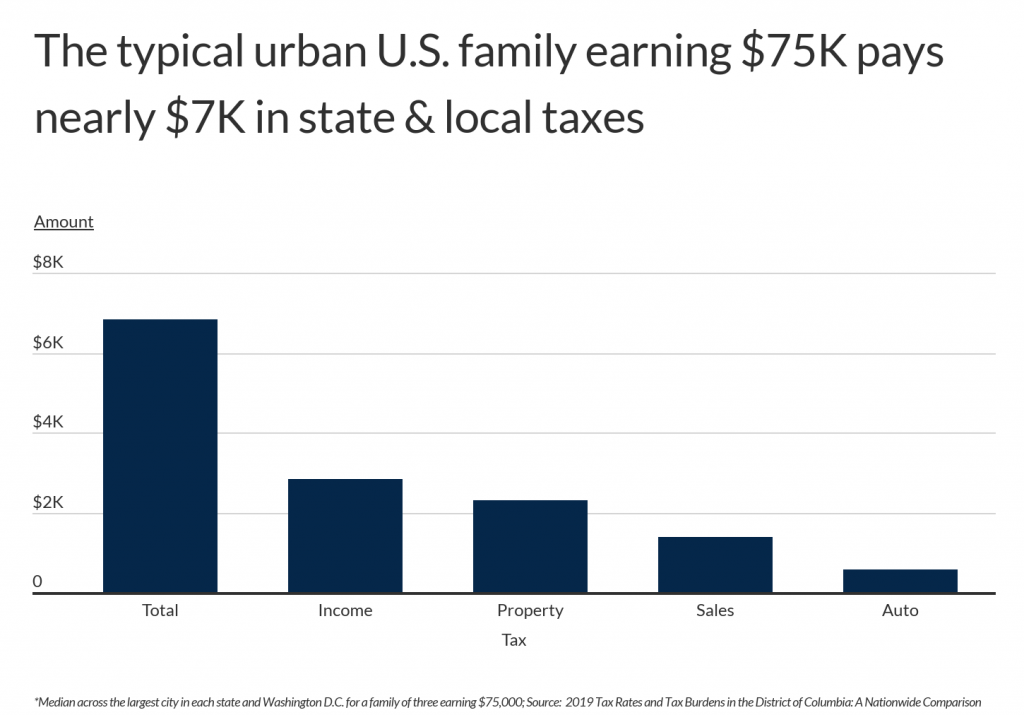
Overall, a typical urban family earning $75,000 annually, which is close to the median household income, will pay approximately $6,825 in taxes each year, or 9.1% of income. State and local income taxes represent the largest share of this total, at $2,827, with property, sales, and auto taxes making up the remainder of the household’s state and local tax obligations. But depending how states and localities structure their taxes, a family could pay more or less across each of these categories—and in some locations, like those highlighted below, state and local taxes can exceed 10% or even 15% of income.

The data used in this study is from the Government of the District of Columbia’s Tax Rates and Tax Burdens In the District of Columbia – A Nationwide Comparison. To determine the U.S. cities where residents pay the most in taxes, researchers at ChamberOfCommerce.org reported the total estimated tax percentage (as a share of family income) for a family of three earning $75,000 per year in each location. The total estimated tax percentage was calculated by summing the estimated state and local income, property, sales, and auto taxes residents are subject to in each location, accounting for differences in the various ways those taxes are levied. Note that only the largest city in each state and Washington, D.C. were included in the study.
Here are the cities where people pay the most in taxes.
Major U.S. Cities With the Highest Taxes

Photo Credit: ESB Professional / Shutterstock
15. Atlanta, GA
- Total estimated tax percentage: 10.5%
- Total estimated tax: $7,871
- Income taxes: $3,137
- Property taxes: $2,524
- Sales taxes: $1,840
- Auto taxes: $370

Photo Credit: Agnieszka Gaul / Shutterstock
14. Columbus, OH
- Total estimated tax percentage: 10.7%
- Total estimated tax: $8,050
- Income taxes: $3,644
- Property taxes: $2,664
- Sales taxes: $1,383
- Auto taxes: $360

Photo Credit: Sean Pavone / Shutterstock
13. Portland, ME
- Total estimated tax percentage: 10.8%
- Total estimated tax: $8,125
- Income taxes: $2,148
- Property taxes: $3,939
- Sales taxes: $1,275
- Auto taxes: $762

Photo Credit: ESB Professional / Shutterstock
12. Los Angeles, CA
- Total estimated tax percentage: 10.9%
- Total estimated tax: $8,157
- Income taxes: $451
- Property taxes: $4,797
- Sales taxes: $1,886
- Auto taxes: $1,023

Photo Credit: Sean Pavone / Shutterstock
11. New York, NY
- Total estimated tax percentage: 11.4%
- Total estimated tax: $8,586
- Income taxes: $4,489
- Property taxes: $1,816
- Sales taxes: $1,739
- Auto taxes: $541

Photo Credit: Sean Pavone / Shutterstock
10. Kansas City, MO
- Total estimated tax percentage: 11.6%
- Total estimated tax: $8,725
- Income taxes: $3,272
- Property taxes: $2,348
- Sales taxes: $2,055
- Auto taxes: $1,050

Photo Credit: f11photo / Shutterstock
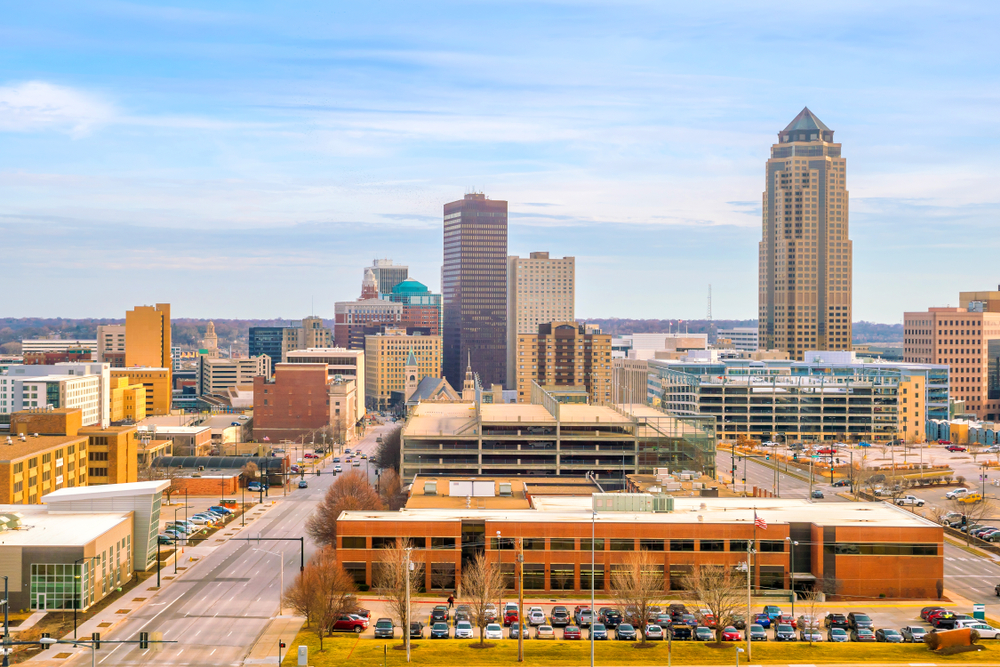
9. Des Moines, IA
- Total estimated tax percentage: 11.9%
- Total estimated tax: $8,907
- Income taxes: $3,151
- Property taxes: $3,834
- Sales taxes: $1,317
- Auto taxes: $605

Photo Credit: Sean Pavone / Shutterstock
8. Philadelphia, PA
- Total estimated tax percentage: 12.0%
- Total estimated tax: $9,027
- Income taxes: $5,206
- Property taxes: $1,919
- Sales taxes: $1,326
- Auto taxes: $575

Photo Credit: Sean Pavone / Shutterstock
7. Louisville, KY
- Total estimated tax percentage: 12.0%
- Total estimated tax: $9,028
- Income taxes: $4,948
- Property taxes: $2,284
- Sales taxes: $1,158
- Auto taxes: $639

Photo Credit: f11photo / Shutterstock
6. Chicago, IL
- Total estimated tax percentage: 12.2%
- Total estimated tax: $9,118
- Income taxes: $3,228
- Property taxes: $2,930
- Sales taxes: $1,922
- Auto taxes: $1,037

Photo Credit: f11photo / Shutterstock
5. Milwaukee, WI
- Total estimated tax percentage: 12.3%
- Total estimated tax: $9,221
- Income taxes: $3,095
- Property taxes: $4,490
- Sales taxes: $1,146
- Auto taxes: $490

Photo Credit: Sean Pavone / Shutterstock
4. Baltimore, MD
- Total estimated tax percentage: 14.1%
- Total estimated tax: $10,605
- Income taxes: $4,786
- Property taxes: $4,152
- Sales taxes: $1,192
- Auto taxes: $475

Photo Credit: Sean Pavone / Shutterstock
3. Newark, NJ
- Total estimated tax percentage: 15.3%
- Total estimated tax: $11,510
- Income taxes: $1,772
- Property taxes: $8,136
- Sales taxes: $1,119
- Auto taxes: $483

Photo Credit: Wendell Guy / Shutterstock
2. Bridgeport, CT
- Total estimated tax percentage: 15.6%
- Total estimated tax: $11,735
- Income taxes: $2,844
- Property taxes: $6,938
- Sales taxes: $1,271
- Auto taxes: $682

Photo Credit: Sean Pavone / Shutterstock
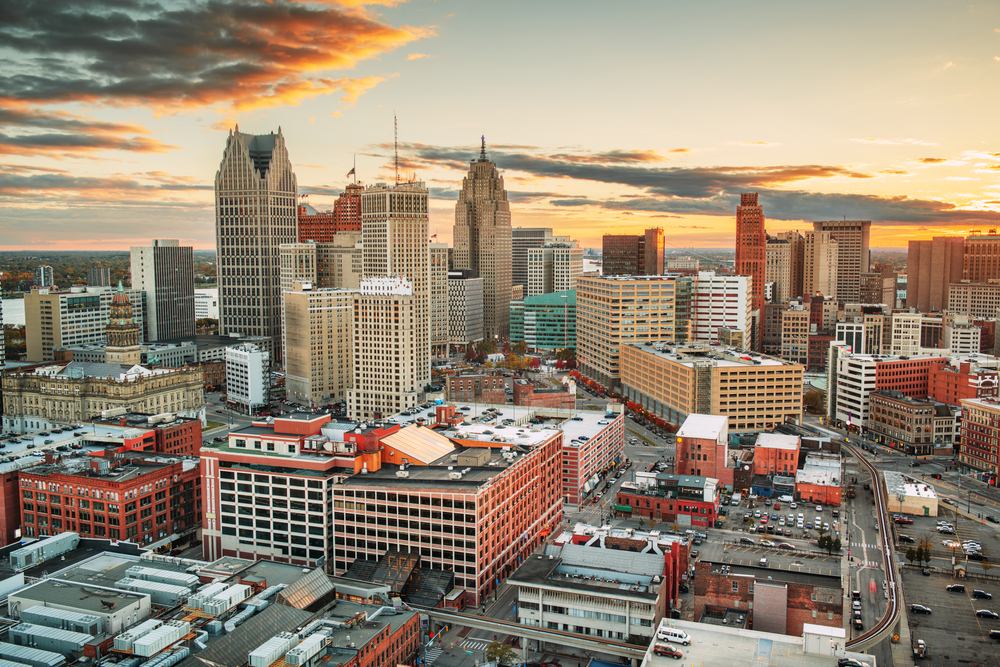
1. Detroit, MI
- Total estimated tax percentage: 16.0%
- Total estimated tax: $12,030
- Income taxes: $4,384
- Property taxes: $5,976
- Sales taxes: $1,134
- Auto taxes: $536
Methodology & Detailed Findings
The data used in this study is from the Government of the District of Columbia’s Tax Rates and Tax Burdens In the District of Columbia – A Nationwide Comparison. To determine the U.S. cities where residents pay the most in taxes, researchers at ChamberOfCommerce.org reported the total estimated tax percentage (as a share of family income) for a family of three earning $75,000 per year in each location. The total estimated tax percentage was calculated by summing the estimated state and local income, property, sales, and auto taxes residents are subject to in each location, accounting for differences in the various ways those taxes are levied. Only the largest city in each state and Washington, D.C. were included.


