


Photo Credit: thanmano / Shutterstock
The widespread turn to remote work was one of the most prominent effects of the COVID-19 economy. When the pandemic struck in the spring of 2020, organizations across the U.S. and the world adapted quickly to accommodate their distributed teams. Fueled by the need to abide by social distancing protocols, employers accelerated the trend toward remote work, making new digital collaboration technologies ubiquitous among the professional class.
This summer, as vaccines became widely available, employers’ stances toward remote work have begun to look more complicated. While some businesses have made hybrid and remote work permanent, a recent survey by the Society for Human Resource Management found that 72% of supervisors would prefer their employees to be back in the office, believing remote arrangements to be worse for networking and collaboration. But as the Delta variant continues to spread this fall, more offices may find themselves delaying or reversing their plans to resume in-person work. Meanwhile, data shows that employees would like to work remotely, at least some of the time, with 55% of employees saying they’d like to be remote at least three days a week.
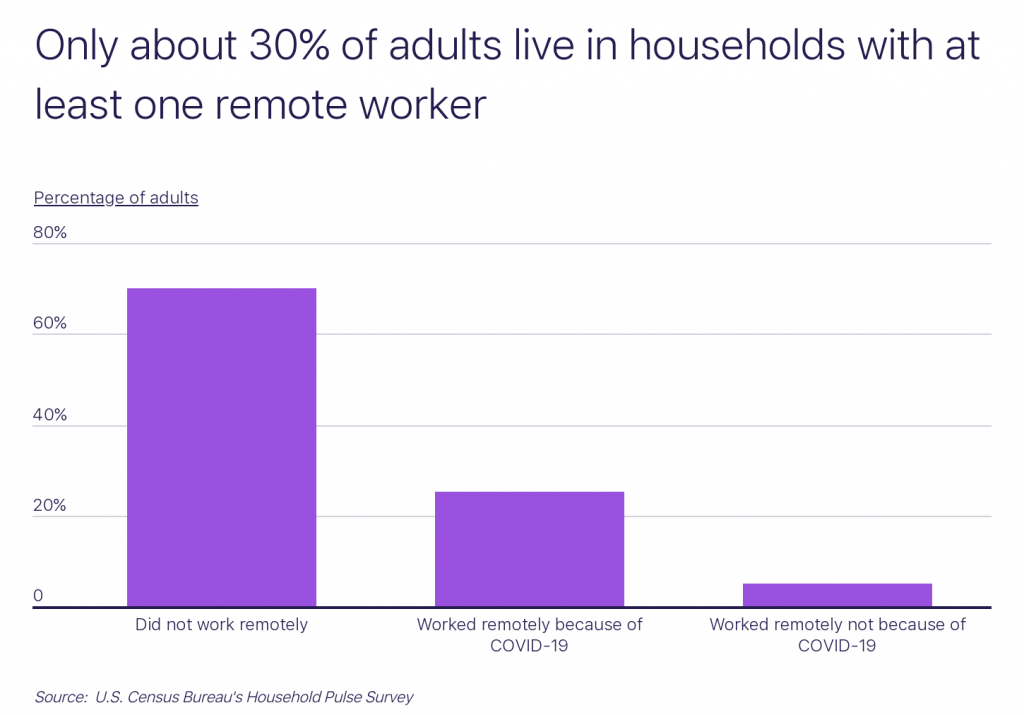
Even though remote workers currently constitute a minority of the U.S. workforce, recent data from the U.S. Census Bureau’s Household Pulse Survey, shows that approximately 30% of adults live in a household with at least one remote worker. This data was collected from mid-April—when vaccines first became available to all adults—through early July—when cases began to rise again. Despite a minority of adults working from home today, certain experts predict a dramatic rise in the coming years, where more than 70% of the workforce could be remote at least one week a month by 2025.
Beyond some employers’ preferences for having workers in the office, the larger reason why remote workers represent a relatively small portion of the workforce is that many professions and industries simply cannot operate remotely. Workers in major industries like food and hospitality, retail, and manufacturing are among those who must be physically present to work.
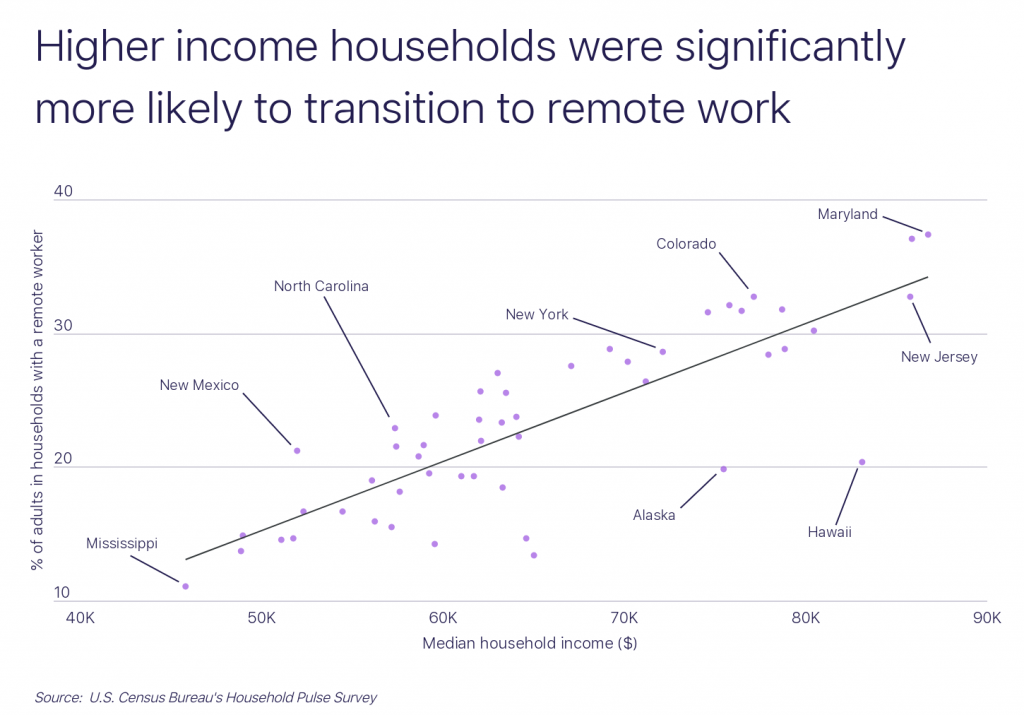
This fact also has the effect of reflecting income inequality between remote and in-person workers. The Household Pulse Survey data shows a strong correlation between median household income and the percentage of adults in households with a remote worker. This suggests that many higher-earning professions easily moved online, while most low-wage hourly jobs could not do so. This divide has created even greater burdens on lower-earning Americans, as the Household Pulse Survey data also reveals a correlation between being unable to work remotely and having difficulty paying household expenses. With the recent expiration of government supports like the eviction moratorium and expanded unemployment benefits, this could make low-wage workers’ financial position even more tenuous as the Delta variant continues to spread.
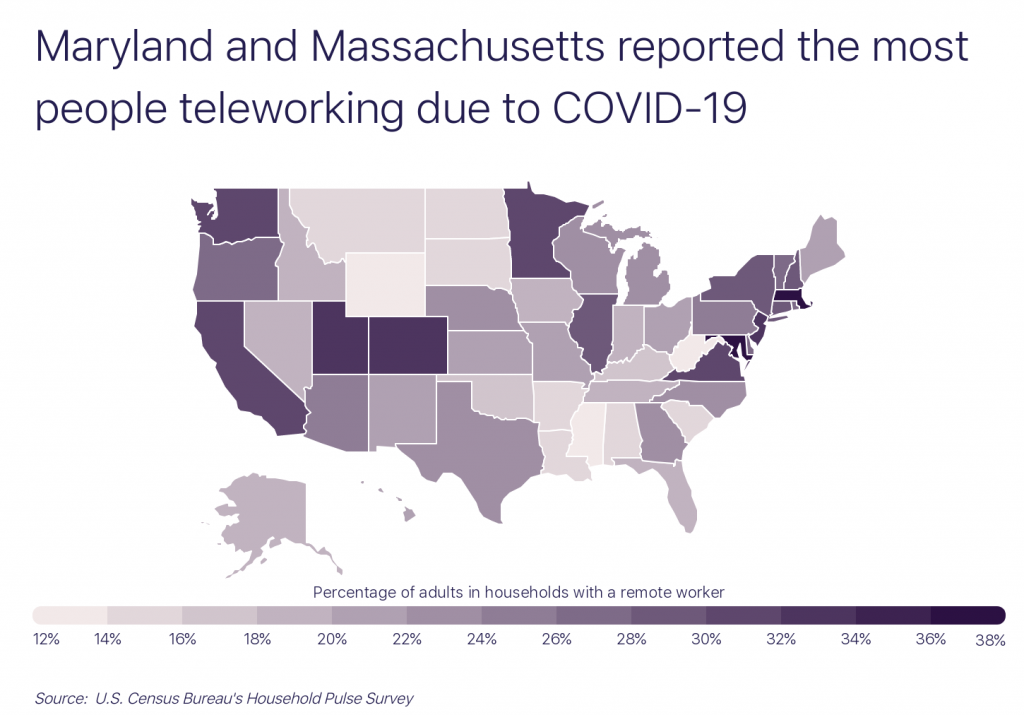
The divergence across industries and income levels also means that remote work is unevenly distributed by geography. Many of the states that have the most households with members working remotely also have more workers in white collar jobs with higher earnings. The two states that had the greatest share of adults in households with a remote worker due to COVID—Maryland at 37.4% and Massachusetts at 37%—also have the highest median household incomes at $86,738 and $85,843, respectively. In contrast, Mississippi has both the lowest share of households with a remote worker at 11.1% and the lowest median income at $45,792. This disparity is also likely due to a higher number of in-person jobs in Mississippi, where demand is high for jobs in food, retail, production, and transportation.
To determine the states where the most people worked remotely because of COVID-19, researchers at Teamflow used data from the U.S. Census Bureau’s Household Pulse Survey to calculate the percentage of adults in households where at least one adult worked from home because of the coronavirus pandemic in the past seven days, averaged over the survey weeks during which this question was asked: April 14, 2021 through July 5, 2021. Notably, this only includes those who worked remotely because of the pandemic, and not those that would have done so regardless. In the event of a tie, the state with the higher number of adults in these households was ranked higher.
Here are the states where the most people worked remotely because of COVID.
States Where the Most People Teleworked Because of COVID-19

Photo Credit: Bob Pool / Shutterstock
15. Oregon
- Percentage of adults in households with a remote worker: 27.5%
- Total adults in households with a remote worker: 905,959
- Percentage of adults in households with expected income loss: 13.9%
- Percentage of adults in households with difficulty paying expenses: 24.2%
- Median household income: $67,058

Photo Credit: Jon Bilous / Shutterstock
14. Delaware
- Percentage of adults in households with a remote worker: 27.8%
- Total adults in households with a remote worker: 211,559
- Percentage of adults in households with expected income loss: 10.0%
- Percentage of adults in households with difficulty paying expenses: 24.2%
- Median household income: $70,176

Photo Credit: Sean Pavone / Shutterstock
13. New Hampshire
- Percentage of adults in households with a remote worker: 28.4%
- Total adults in households with a remote worker: 304,889
- Percentage of adults in households with expected income loss: 7.6%
- Percentage of adults in households with difficulty paying expenses: 21.2%
- Median household income: $77,933

Photo Credit: Victor Moussa / Shutterstock
12. New York
- Percentage of adults in households with a remote worker: 28.6%
- Total adults in households with a remote worker: 4,141,233
- Percentage of adults in households with expected income loss: 16.1%
- Percentage of adults in households with difficulty paying expenses: 29.5%
- Median household income: $72,108

Photo Credit: Sean Pavone / Shutterstock
11. Connecticut
- Percentage of adults in households with a remote worker: 28.8%
- Total adults in households with a remote worker: 772,712
- Percentage of adults in households with expected income loss: 11.0%
- Percentage of adults in households with difficulty paying expenses: 25.7%
- Median household income: $78,833

Photo Credit: Oleg Podzorov / Shutterstock
10. Illinois
- Percentage of adults in households with a remote worker: 28.8%
- Total adults in households with a remote worker: 2,705,697
- Percentage of adults in households with expected income loss: 12.9%
- Percentage of adults in households with difficulty paying expenses: 25.5%
- Median household income: $69,187

Photo Credit: yhelfman / Shutterstock
9. California
- Percentage of adults in households with a remote worker: 30.2%
- Total adults in households with a remote worker: 8,889,098
- Percentage of adults in households with expected income loss: 18.3%
- Percentage of adults in households with difficulty paying expenses: 28.9%
- Median household income: $80,440

Photo Credit: Checubus / Shutterstock
8. Minnesota
- Percentage of adults in households with a remote worker: 31.6%
- Total adults in households with a remote worker: 1,333,846
- Percentage of adults in households with expected income loss: 9.0%
- Percentage of adults in households with difficulty paying expenses: 19.4%
- Median household income: $74,593

Photo Credit: Sean Pavone / Shutterstock
7. Virginia
- Percentage of adults in households with a remote worker: 31.7%
- Total adults in households with a remote worker: 2,042,937
- Percentage of adults in households with expected income loss: 11.0%
- Percentage of adults in households with difficulty paying expenses: 24.3%
- Median household income: $76,456

Photo Credit: Jeremy Janus / Shutterstock
6. Washington
- Percentage of adults in households with a remote worker: 31.8%
- Total adults in households with a remote worker: 1,867,950
- Percentage of adults in households with expected income loss: 13.1%
- Percentage of adults in households with difficulty paying expenses: 23.3%
- Median household income: $78,687

Photo Credit: Maciej Bledowski / Shutterstock
5. Utah
- Percentage of adults in households with a remote worker: 32.1%
- Total adults in households with a remote worker: 737,725
- Percentage of adults in households with expected income loss: 7.1%
- Percentage of adults in households with difficulty paying expenses: 20.1%
- Median household income: $75,780

Photo Credit: Mihai_Andritoiu / Shutterstock
4. New Jersey
- Percentage of adults in households with a remote worker: 32.7%
- Total adults in households with a remote worker: 2,177,152
- Percentage of adults in households with expected income loss: 14.3%
- Percentage of adults in households with difficulty paying expenses: 26.2%
- Median household income: $85,751

Photo Credit: Nicholas Courtney / Shutterstock
3. Colorado
- Percentage of adults in households with a remote worker: 32.7%
- Total adults in households with a remote worker: 1,457,040
- Percentage of adults in households with expected income loss: 10.9%
- Percentage of adults in households with difficulty paying expenses: 23.6%
- Median household income: $77,127

Photo Credit: ESB Professional / Shutterstock
2. Massachusetts
- Percentage of adults in households with a remote worker: 37.0%
- Total adults in households with a remote worker: 1,937,975
- Percentage of adults in households with expected income loss: 11.9%
- Percentage of adults in households with difficulty paying expenses: 20.6%
- Median household income: $85,843

Photo Credit: Sean Pavone / Shutterstock
1. Maryland
- Percentage of adults in households with a remote worker: 37.4%
- Total adults in households with a remote worker: 1,689,976
- Percentage of adults in households with expected income loss: 12.9%
- Percentage of adults in households with difficulty paying expenses: 25.2%
- Median household income: $86,738
Detailed Findings & Methodology
The data used in this analysis is from the U.S. Census Bureau’s Household Pulse Survey. To determine the states where the most people worked remotely because of COVID-19, researchers calculated the percentage of adults in households where at least one adult teleworked because of the coronavirus pandemic in the past seven days, averaged over the survey weeks during which this question was asked: April 14, 2021 through July 5, 2021. In the event of a tie, the state with the higher number of adults in these households was ranked higher. It’s important to note that the data shown are averages of the weekly statistics. As such, they represent the typical number of people in households where someone teleworked due to the pandemic at any given point in time, rather than the cumulative number of such people.